


Site Prices Update
Last Updated28th June 2022
All calculations on this site are based on current fuel prices, they are checked regularly and calculations are automatically updated.
The costs calculated based on these fuel prices should be regarded as 'good estimates', given that fuel prices vary in different parts of the county and at different time of the year.
The calculations also have different levels of accuracy depending on the nature of the calculation. For example calculating the energy use of a known power output TV is very easy compared to calculating the effect on energy savings when insulating a cavity wall.
Site Calculations
Set Your Own Prices
User PricesFor several of the fuel prices on this site you can now set your own prices and all the calculations on the site will adjust accordingly.
Set Prices
At Confused About Energy we aim to provide practical, impartial advice on all aspects of energy usage, climate change and ways to save money on energy bills.
All calculations on this site are based on current fuel prices they are checked regularly are automatically updated and were last changed on:-
28th June 2022
The costs calculated based on these fuel prices should be regarded as 'good estimates', given that fuel prices vary in different parts of the county and at different time of the year.
The calculations also have different levels of accuracy depending on the nature of the calculation. For example calculating the energy use of a known power output TV is very easy compared to calculating the effect on energy savings when insulating a cavity wall.
Site Calculations
| Electricity | £0.271 per unit (1 kWh) |
| Economy Electricity | £0.094 per unit (1 kWh) |
| Gas | £0.072 per unit (1 kWh) |
| Domestic LPG | £0.122 per unit (1 kWh) |
| Heating Oil | £0.104 per unit (1 kWh) |
| UK Grid CO2 Emissions | 0.233 kg per kWh used |
The main units used in this site are in the table below, For a complete explanation of power and energy Read More.
| Unit | Name | Detail |
|---|---|---|
| W | Watt | Unit of Power |
| kW | Kilowatt | 1000 watts |
| kWh | Kilowatt hour | Measure of Energy |
| L | Litre | Measure of Volume |
Electricity Cost Calculator
Read More


Please use twitter to ask a question Message @@EnergyThinking
The terms solar energy and solar power are often used to describe technologies which collect the energy of the sun and redistribute it for our use. These terms are however a little ambiguous...
|
Cost: High
ROI: 7 ±3 Years (No FIT)
Skill: Specialist
Energy Saving: Medium
CO2e Saving: High
|
ROI is the time it takes to return the investment in fuel savings for an average gas heated 3 bed semi-detached house and assumes no government incentive schemes are used: Years
How easy this is to do: DIY-Easy : DIY-Skilled : Specialist
How much energy will be saved with this measure: Low : Medium : High
How much Carbon Dioxide emission will be saved with this measure: Low : Medium : High
For example, solar energy effectively drives our whole planet, wind, wave and fossil fuels could ultimately be regarded as solar energy.
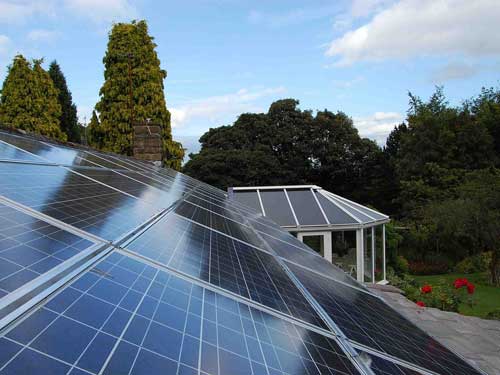
For the purposes of this site our only concern is for solar energy that can be collected directly by our dwelling and used to, for example, heat water or to drive our electric devices. For this article only Solar Photovoltaic power generation is considered. Please follow the link to take a look at Solar hot water.
To collect solar energy a method is required to collect photons of light and to convert the energy in this light into another form of energy for storage or use.
In photovoltaic’s this energy is directly transferred into electrical energy using solar cells, the energy may then be stored in a battery, used immediately in your house or sold back to the grid.
Is it worth it?
On the face of it, it should be quite straight forward to calculate how sensible an investment in photovoltaic power generation is likely to be. The number of variables is however extraordinary, here are the more important
- How sunny is it where you live.
- How dirty is your panal
- The orientation of solar panel, (North, South, East, West).
- The angle of the panel.
- The size of the intended panel.
- The efficiency of the solar cells.
- Efficiency of the electrical systems, (invertors and power storage)
- The cost of the installation.
- The cost of mains electricity.
- The value of government incentive schemes to encourage you to install them.
The first term that you generally come across when looking into solar modules is the term Kilowatt peak (kWp) or peak power. This value specifies the output power achieved by a Solar module under solar radiation under set standard test conditions. Standard test conditions use a solar radiation level of 1,000 watts per square meter (W/m2).
As an example, take an 8m2, 1kW peak system (1 kWp). This means that under test radiation conditions of 1000 W/m2 this panel is capable of producing a 1kW power output. A general consensus of suppliers indicates that such a unit should produce 750 kWh of electricity per year in the UK, if correctly oriented. (As physically smaller 1kW peak system would produce the same but would have more efficient solar cells.)
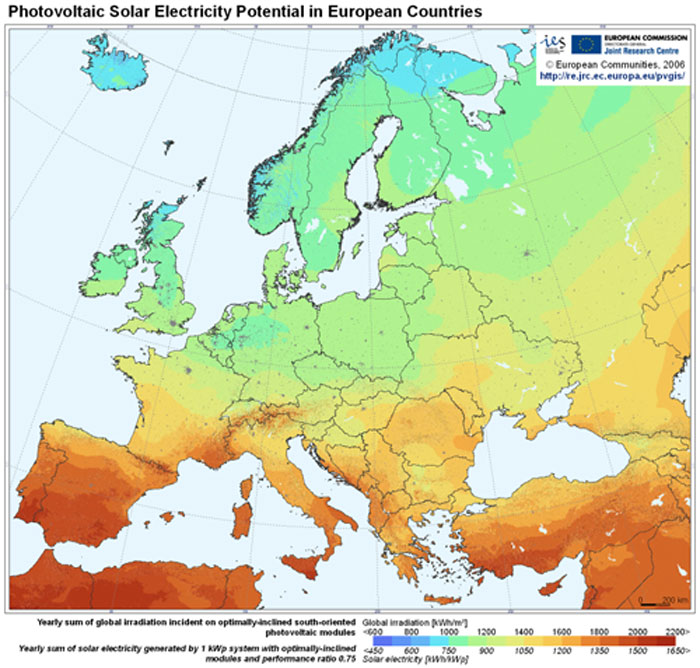
The tables below give an indication of how these values might be derived and considers different radiation level across the UK and the world and various panal efficiencies, but it is very rough. If you are interested there is also a solar radiation map of Europe at the bottom of the article. We also show how much carbon dioxide emission you are preventing by generating your own.
* The figures calculated for useable energy include an efficiency factor for pre-photovotaic losses and system losses, this is approximately 25%. Also just to be clear the values calculate are for 1m2 of panal, a normal house installation may have 20 to 30m2 installed.
N.B. FITS and government incentives are not included in these calculation, they just change too often.
| Solar panal efficiency | 12% | 14% | 16% | 18% | 20% | 22% | 24% | 26% |
|---|---|---|---|---|---|---|---|---|
Useable energy with irradiation level 900 kWh/m2/year) * Grid cost of equivalent energy(CO2e emission reduction) Scotland - North |
81 kWh/year £21.951 |
94.5 kWh/year £25.61 |
108 kWh/year £29.268 |
121.5 kWh/year £32.927 |
135 kWh/year £36.585 |
148.5 kWh/year £40.244 |
162 kWh/year £43.902 |
175.5 kWh/year £47.561 |
Useable energy with irradiation level 1000 kWh/m2/year) * Grid cost of equivalent energy(CO2e emission reduction) Scotland - South |
90 kWh/year £24.39 |
105 kWh/year £28.455 |
120 kWh/year £32.52 |
135 kWh/year £36.585 |
150 kWh/year £40.65 |
165 kWh/year £44.715 |
180 kWh/year £48.78 |
195 kWh/year £52.845 |
Useable energy with irradiation level 1100 kWh/m2/year) * Grid cost of equivalent energy(CO2e emission reduction) England - North, Germany |
99 kWh/year £26.829 |
115.5 kWh/year £31.301 |
132 kWh/year £35.772 |
148.5 kWh/year £40.244 |
165 kWh/year £44.715 |
181.5 kWh/year £49.187 |
198 kWh/year £53.658 |
214.5 kWh/year £58.13 |
Useable energy with irradiation level 1200 kWh/m2/year) * Grid cost of equivalent energy(CO2e emission reduction) England - South |
108 kWh/year £29.268 |
126 kWh/year £34.146 |
144 kWh/year £39.024 |
162 kWh/year £43.902 |
180 kWh/year £48.78 |
198 kWh/year £53.658 |
216 kWh/year £58.536 |
234 kWh/year £63.414 |
Useable energy with irradiation level 1300 kWh/m2/year) * Grid cost of equivalent energy(CO2e emission reduction) Canada - South |
117 kWh/year £31.707 |
136.5 kWh/year £36.992 |
156 kWh/year £42.276 |
175.5 kWh/year £47.561 |
195 kWh/year £52.845 |
214.5 kWh/year £58.13 |
234 kWh/year £63.414 |
253.5 kWh/year £68.699 |
Useable energy with irradiation level 1400 kWh/m2/year) * Grid cost of equivalent energy(CO2e emission reduction) France |
126 kWh/year £34.146 |
147 kWh/year £39.837 |
168 kWh/year £45.528 |
189 kWh/year £51.219 |
210 kWh/year £56.91 |
231 kWh/year £62.601 |
252 kWh/year £68.292 |
273 kWh/year £73.983 |
Useable energy with irradiation level 1500 kWh/m2/year) * Grid cost of equivalent energy(CO2e emission reduction) Italy |
135 kWh/year £36.585 |
157.5 kWh/year £42.683 |
180 kWh/year £48.78 |
202.5 kWh/year £54.878 |
225 kWh/year £60.975 |
247.5 kWh/year £67.073 |
270 kWh/year £73.17 |
292.5 kWh/year £79.268 |
Useable energy with irradiation level 1600 kWh/m2/year) * Grid cost of equivalent energy(CO2e emission reduction) Australia - South |
144 kWh/year £39.024 |
168 kWh/year £45.528 |
192 kWh/year £52.032 |
216 kWh/year £58.536 |
240 kWh/year £65.04 |
264 kWh/year £71.544 |
288 kWh/year £78.048 |
312 kWh/year £84.552 |
Useable energy with irradiation level 1700 kWh/m2/year) * Grid cost of equivalent energy(CO2e emission reduction) USA - Florida |
153 kWh/year £41.463 |
178.5 kWh/year £48.374 |
204 kWh/year £55.284 |
229.5 kWh/year £62.195 |
255 kWh/year £69.105 |
280.5 kWh/year £76.016 |
306 kWh/year £82.926 |
331.5 kWh/year £89.837 |
Useable energy with irradiation level 1800 kWh/m2/year) * Grid cost of equivalent energy(CO2e emission reduction) India, Spain |
162 kWh/year £43.902 |
189 kWh/year £51.219 |
216 kWh/year £58.536 |
243 kWh/year £65.853 |
270 kWh/year £73.17 |
297 kWh/year £80.487 |
324 kWh/year £87.804 |
351 kWh/year £95.121 |
Useable energy with irradiation level 1900 kWh/m2/year) * Grid cost of equivalent energy(CO2e emission reduction) Brazil - Pantanal |
171 kWh/year £46.341 |
199.5 kWh/year £54.065 |
228 kWh/year £61.788 |
256.5 kWh/year £69.512 |
285 kWh/year £77.235 |
313.5 kWh/year £84.959 |
342 kWh/year £92.682 |
370.5 kWh/year £100.406 |
Useable energy with irradiation level 2000 kWh/m2/year) * Grid cost of equivalent energy(CO2e emission reduction) Australia - North, California, South Africa |
180 kWh/year £48.78 |
210 kWh/year £56.91 |
240 kWh/year £65.04 |
270 kWh/year £73.17 |
300 kWh/year £81.3 |
330 kWh/year £89.43 |
360 kWh/year £97.56 |
390 kWh/year £105.69 |
Useable energy with irradiation level 2100 kWh/m2/year) * Grid cost of equivalent energy(CO2e emission reduction) Nigeria |
189 kWh/year £51.219 |
220.5 kWh/year £59.756 |
252 kWh/year £68.292 |
283.5 kWh/year £76.829 |
315 kWh/year £85.365 |
346.5 kWh/year £93.902 |
378 kWh/year £102.438 |
409.5 kWh/year £110.975 |
Useable energy with irradiation level 2200 kWh/m2/year) * Grid cost of equivalent energy(CO2e emission reduction) Saudi Arabia |
198 kWh/year £53.658 |
231 kWh/year £62.601 |
264 kWh/year £71.544 |
297 kWh/year £80.487 |
330 kWh/year £89.43 |
363 kWh/year £98.373 |
396 kWh/year £107.316 |
429 kWh/year £116.259 |
Useable energy with irradiation level 2300 kWh/m2/year) * Grid cost of equivalent energy(CO2e emission reduction) Peru - South |
207 kWh/year £56.097 |
241.5 kWh/year £65.447 |
276 kWh/year £74.796 |
310.5 kWh/year £84.146 |
345 kWh/year £93.495 |
379.5 kWh/year £102.845 |
414 kWh/year £112.194 |
448.5 kWh/year £121.544 |
Useable energy with irradiation level 2400 kWh/m2/year) * Grid cost of equivalent energy(CO2e emission reduction) Sahara! |
216 kWh/year £58.536 |
252 kWh/year £68.292 |
288 kWh/year £78.048 |
324 kWh/year £87.804 |
360 kWh/year £97.56 |
396 kWh/year £107.316 |
432 kWh/year £117.072 |
468 kWh/year £126.828 |
To determine if a system is financially viable in the Sunny UK it is instructive to use the installers own figures, however the installers do not generally state which part of the UK their figures are applicable to, probably Cornwall! So be wary.
 The calculations in this article so far do not allow for the Feed-In Tariff (FITs) incentive schemes for renewable energy systems in the UK. They show raw calculations based on the true cost of grid electricity which is being replaced by the renewable energy system. With the FIT's scheme you are essentially paid by the government via electricity companies much more than the electricity is worth, even if you are using what you have generated. With the Feed-In Tariff solar PV looks a lot better, use this website, Energy Savings Trust to get more details and to determine the current rules regulations and eligibility.
| Price of fully installed system | 2kWp system producing 1500kWh per year (middle England) | 4kWp system producing 3000kWh per year (middle England) |
|---|---|---|
| £3000 | 7 years | 4 years |
| £4000 | 10 years | 5 years |
| £5000 | 12 years | 6 years |
| £6000 | 15 years | 7 years |
| £7000 | 17 years | 9 years |
Some Useful Links:-
http://solargis.com/assets/graphic/free-map/GHI/Solargis-World-GHI-solar-resource-map-en.png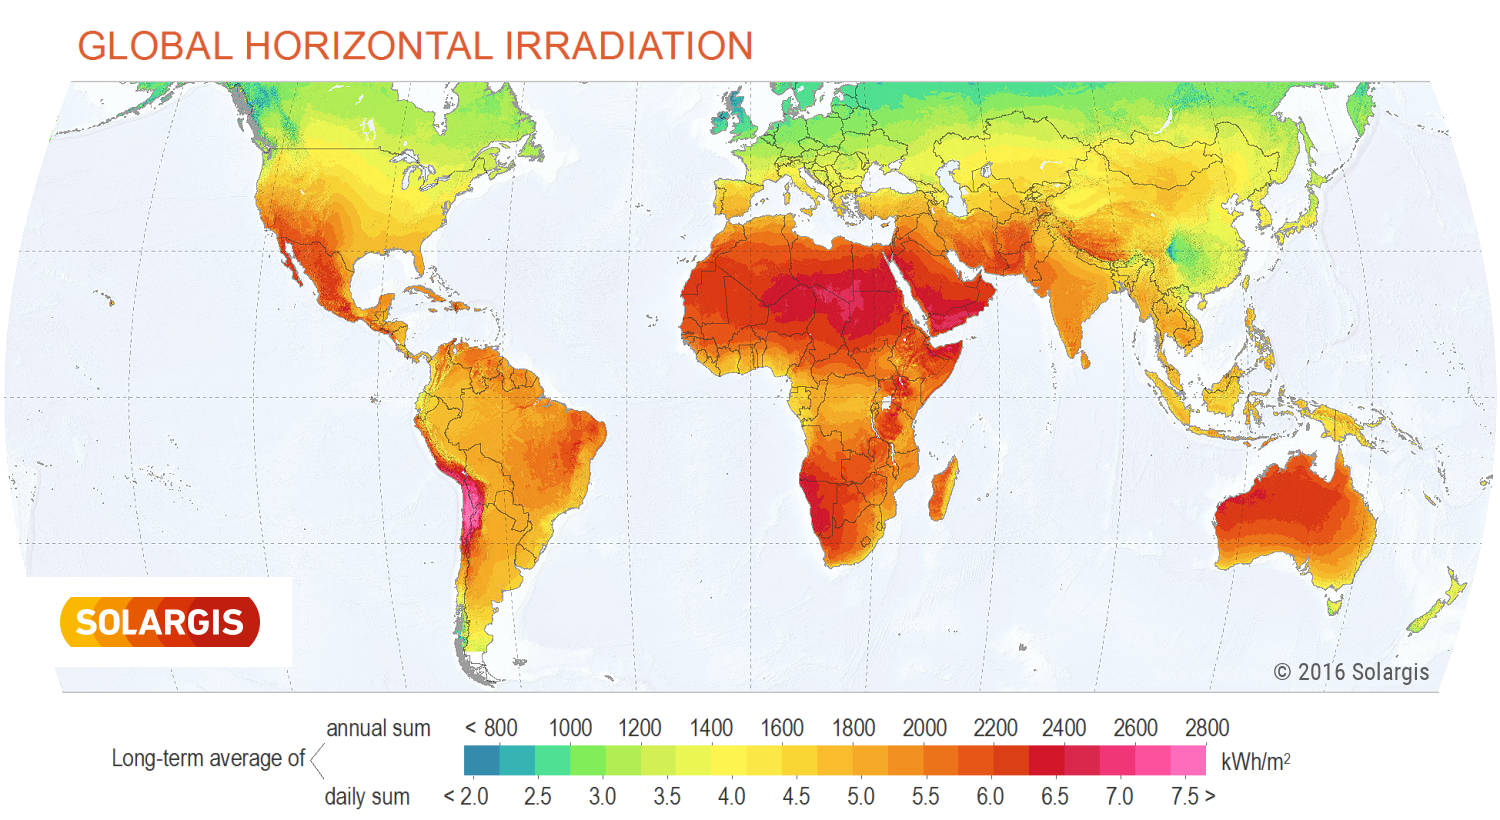
http://solargis.com/products/maps-and-gis-data/free/overview/
http://www.greenrhinoenergy.com/solar/technologies/pv_energy_yield.php
Has this site been updated in the last 5 years, as that's around the age of the prices and efficiency ratings you're using?
A 'typical' solar pv system outside London should cost no more than £1500 per kW for a 4kW install and £2000 per kW for the really small ones (1-2 kW) and if anyone outside London quotes more than that, they're robbing you blind (unless all materials used are top-of-the-range)
As for generation figures, MCS now require everyone to base their quotes on a specific set of data, which should ensure that you get exactly the same figures for proposed generation, no matter how many quotes you get, even though their figures are only around 70% accurate in some areas.
Hi Andrew
Yes, last week, but a different section!
Is this an installed price you quote? or just for the parts, the table goes down to £3000 for installed. And the more you stick up there on the roof the cheaper it gets.
If this is an installed price please add some links to a reply, I cannot find them, I will then happily amend the data, lowest I have found is £2800.
As for efficiency this is irrelevant given the way the calculations work above since they use a surface area. As panels get more efficient manufacturers reduce the surface area and they remain as 1kWp. so 5 years ago a 1kWp system was 8m2 it is now smaller.
cheers
Richard
I have a 2.5kW system taking up 13.8m2 of roof space (HIT-H250E01 panels), it is south west facing and in Nottingham, so it is far from ideal. It generated 2.16MWh usable electricity in the 1st year, that is 45% higher than your best case scenario.
These people publish their figures month by month and are doing about 15% better than me based on system size:
http://solarphotovoltaicsinexeter.blogspot.co.uk/
The price per KW is also wrong, a quick Google search for "4kW solar" indicates that the current price is about 33% of the price used in your calculations, as an example:
http://www.navitron.org.uk/forum/index.php?topic=19728.0
Thanks very much for the comment, It is appreciated.
The Article uses a 1kWp system as an example. According to the article tables with a 2.5kWp system in Nottingham, you should generate approximately 792 x 2.5 = 1980kWh. not a million miles from your numbers. I would say there is also a +/-10% error in all of these figures. I'll make that clearer.
Also we do not quote a price anywhere instead we give examples of 'fictitious' systems which range from £3000 to £6000 installed price
Granted we should add a 4kWp system to the calcs, as the cost of these is proportionally lower. We will add this soonish.
Thanks
Richard
its not about sun its about light, these panels work on cloudy days. Light hours is more important than 'is it sunny where you live?'
Yes Colin, if there are photons of the correct frequency impinging on a panal in the correct way they will be collected. however if a cloud is in the way of the sun there will be less photons to collect and therefore less electricity will be generated. True it is about light hours but also the intensity of the light hours.
You will need to update this today in the light of the appeal, but your costs are very high. Prices have dropped significantly. The energy saving trust calculator is hopelessly wrong according to our real data for the north of Scotland, giving twice as long pay back time as we are actually likely to get. We got 3100kWh last year from a 3.5 kW system. This now costs about £10000.
Other discrepancies
1. Solar PV panels are more efficient when colder (20 degree optimum), so although there is less light they are more efficient in the north
2. The EST calculator takes no account of RPI (guaranteed for FITs) or energy price increases over 25 years. A bank would not be allowed to give such misleading figures.
Hi Anne
Can you send me some hard facts and a full study on this and I will be happy to do a full case study on this using this data, provided that it is verified and factual. How efficient do you say the cells are?
my data suggests a 3.5kWp system will provide 2268 kWh per year. so if the true number is 3100, based on more efficient cells and with the install cost is £10,000, then yes the article needs to be revised. I look forward to the data.
All the best
Richard
pity about FITS!!!!
Have a look at this link
http://www.navitron.org.uk/forum/index.php?topic=16066.0
Most seem to be quoting about 3 kWh per day on average for a 3ish kWp system. This is entirely consistent with the article above
Your daily average power gen is so much better than most of these. We find that the efficiency difference of solar cell with temperature across the UK is very small sub one percent, and at the very most light conversion efficiencies are 14% for a reasonably priced system.
Sincerely do you have some tips for others??
Also we cannot find an install cost as cheap as you suggest, nearest we can find is £16,000 for 3.5 kWp. But we agree they have come down in prices and we have added a new price to the article £5,500 for 1 kWp.
We keep being told the payback quoted here is too long, but no one provides any evidence. We like facts.
We have updated this article and included FITS data, at long last!
This might be the case previously but not any more. Presently, the cost of leading German brands at 0.8-1 Euro where as Chinese manufacturer gives at 0.8 USD per watt.
If further add-up for shipping, imports duties, VAT, cabling&inverter and labour cost and all other can not be in extreme case more than 80% additional. Further adding margins at 20% it can not be more than double. i.e. German panels can not be more than 2 Euro and Chinese panel 1.6 USD per watt.
So for 1KW (i.e. 1000 watt) system can not cost more than 2000 Euro (1600 GBP) for German & 1600 USD (1000 GBP) for Chinese.
Further efficiency of inverter are in range of 95% to 99% depending on manufacture. In extreme case balance of systems (i.e. excluding panels) efficiency can not be less than 80% (and not 75% as highlighted)
The cost of storage (i.e. batteries) is very high, but not that high also, such that the cost of system can be 3 to 5 times above calculated cost (i.e. it make the cost of 1 KW system in the range of 5500 GBP). Further the use of storage is optional, depends on the applications and size/calculation varies significantly.
I also agree, FITS and subsidies are not sustainable solutions and need to be taken into considerations since it is nearly impossible for any government to sustain such freebies in present economic climate or in long run.
So ROI and payback period is definitely not in the range that has been highlighted over here. Further well balanced systems (irrespective of orientation) can be easily in the range of 5-7 years. Which is not bad, compare to YoY bank interests rate are in range for 7-9% for loan or 3-5% for fixed term deposits.
We are very interested in what you have to say be could you rephrase so that we can understand your points.A main cost is install labour, it is never a trivial expense, get a quote and find out for yourself, I can barely understand any of the rest of your commentcheersRichard
This information is hopelessly out of date and misleading. Payback is typically 8-10 years.
Hi Seb
please quantify what you are saying, are your comments based on solar technology or on the feed in tarriff scheme in the United Kingdom. The Feed in tarriff scheme does indeed provide a much better payback time and it probably is about 8-10 years as you say. But it is a market distortion and is likely to be tempory, it pays 5 times (about) the market rate for the green electricity. The article above is based only on the physics of solar cells, invertor efficiency, the sun, your geography installation cost and the standard electricity tarriff. In this context the only thing that can make the above out of date is much more efficient solar cells, from 12% efficient to over 50%. This has not happened.
all the best
Richard
According to some, the new Feed-in-tariffs makes solar a bit more positive in terms of investment. Any chance of updating this page with FITS included in costings?
This is on the to do list and you are of course correct. I do wonder how long FITS (feed in tarriffs) will last however. So if I do an ROI calc it must assume the FITS endure. I bet they won't. Thoughts are very welcome
Comments and Questions